market_report
6.1 Market

Slide 1 - Cover (LAVisions layout)layout: title_hero · 16:9

plumbline
Market Opportunity
The blind spot, brought to light.
MK 01 / 10
MARKET OPPORTUNITY
Preconstruction software is a $28B market, and AI is what finally opens it.
$28BTAM
Global construction estimating and preconstruction software and services.
Every firm that bids work has to estimate it first.
$6.5BSAM
US commercial general contractors, preconstruction software.
Where drawing-set AI and bid assembly land first.
$48MSOM
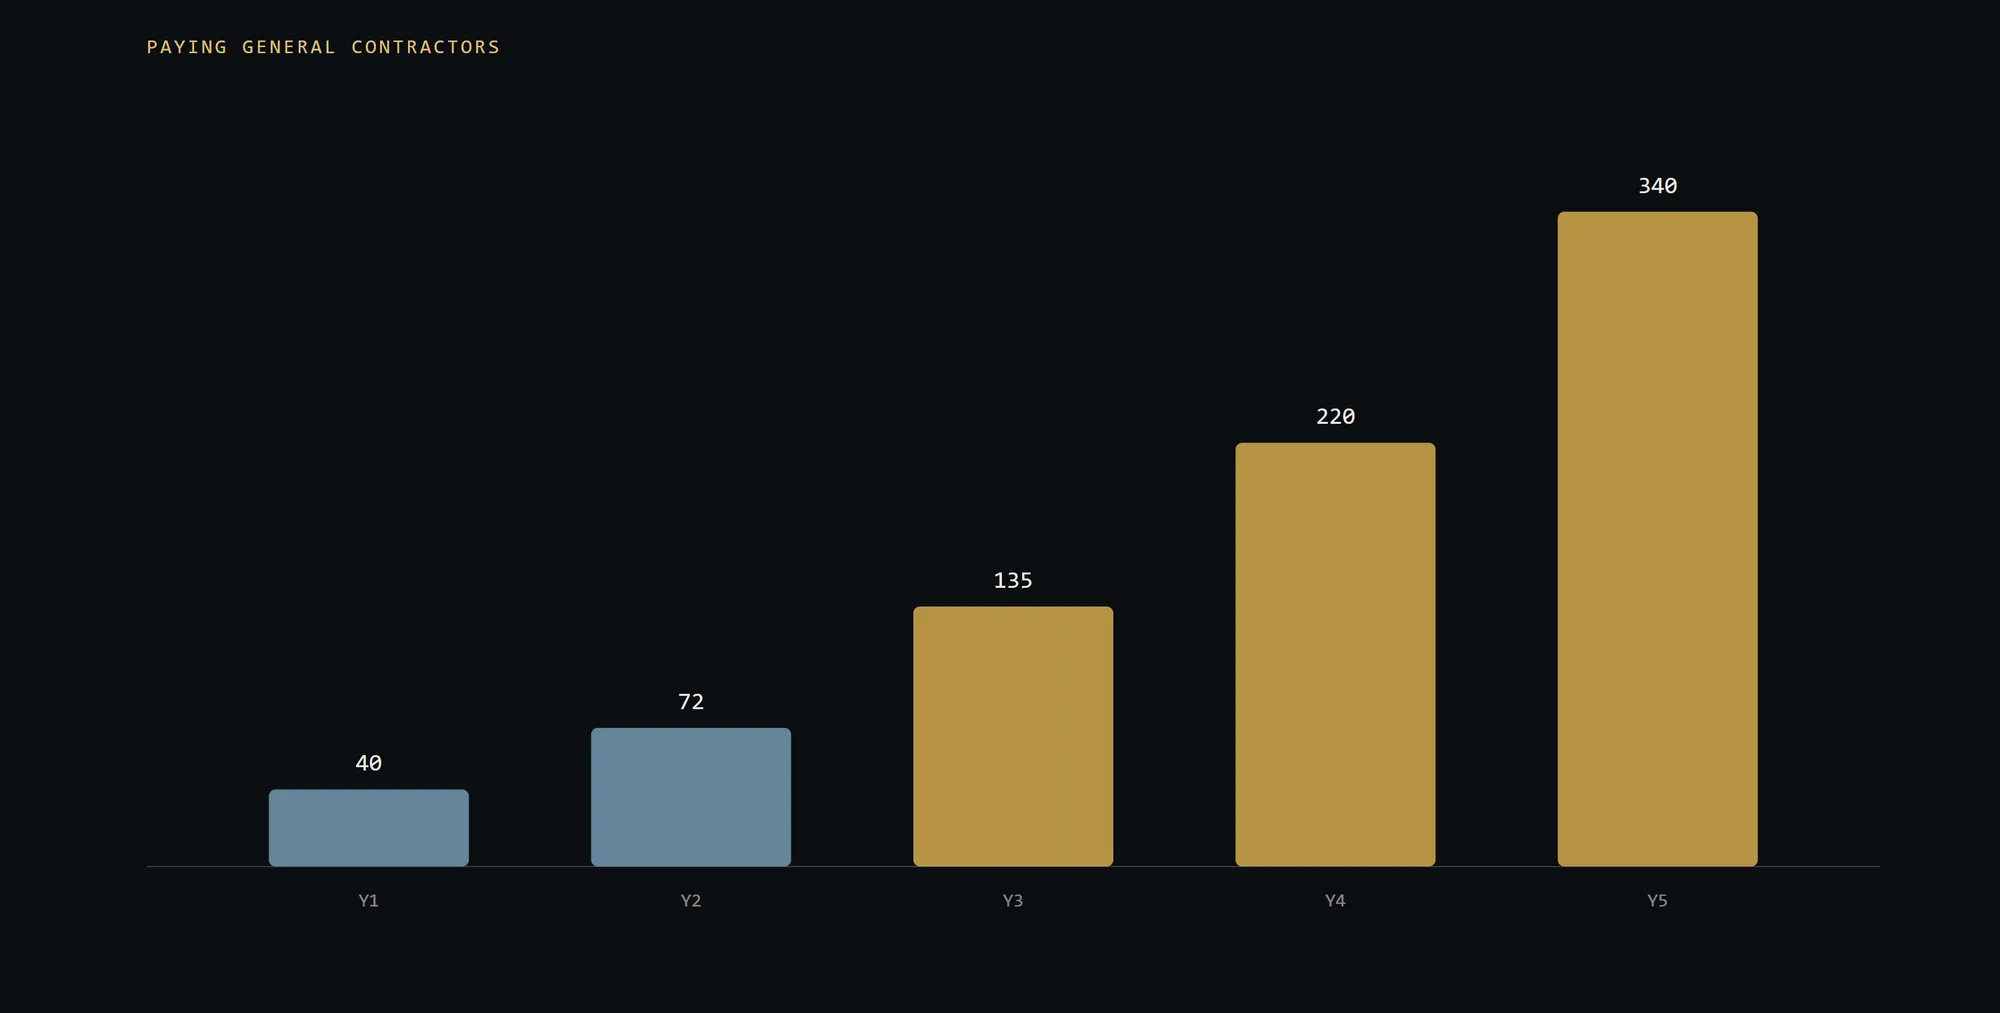
Plumbline Year-5 revenue: 340 paying GCs at $141K each.
Under 1% of the serviceable market, so the headroom stays large.
MK 02 / 10
WHY NOW
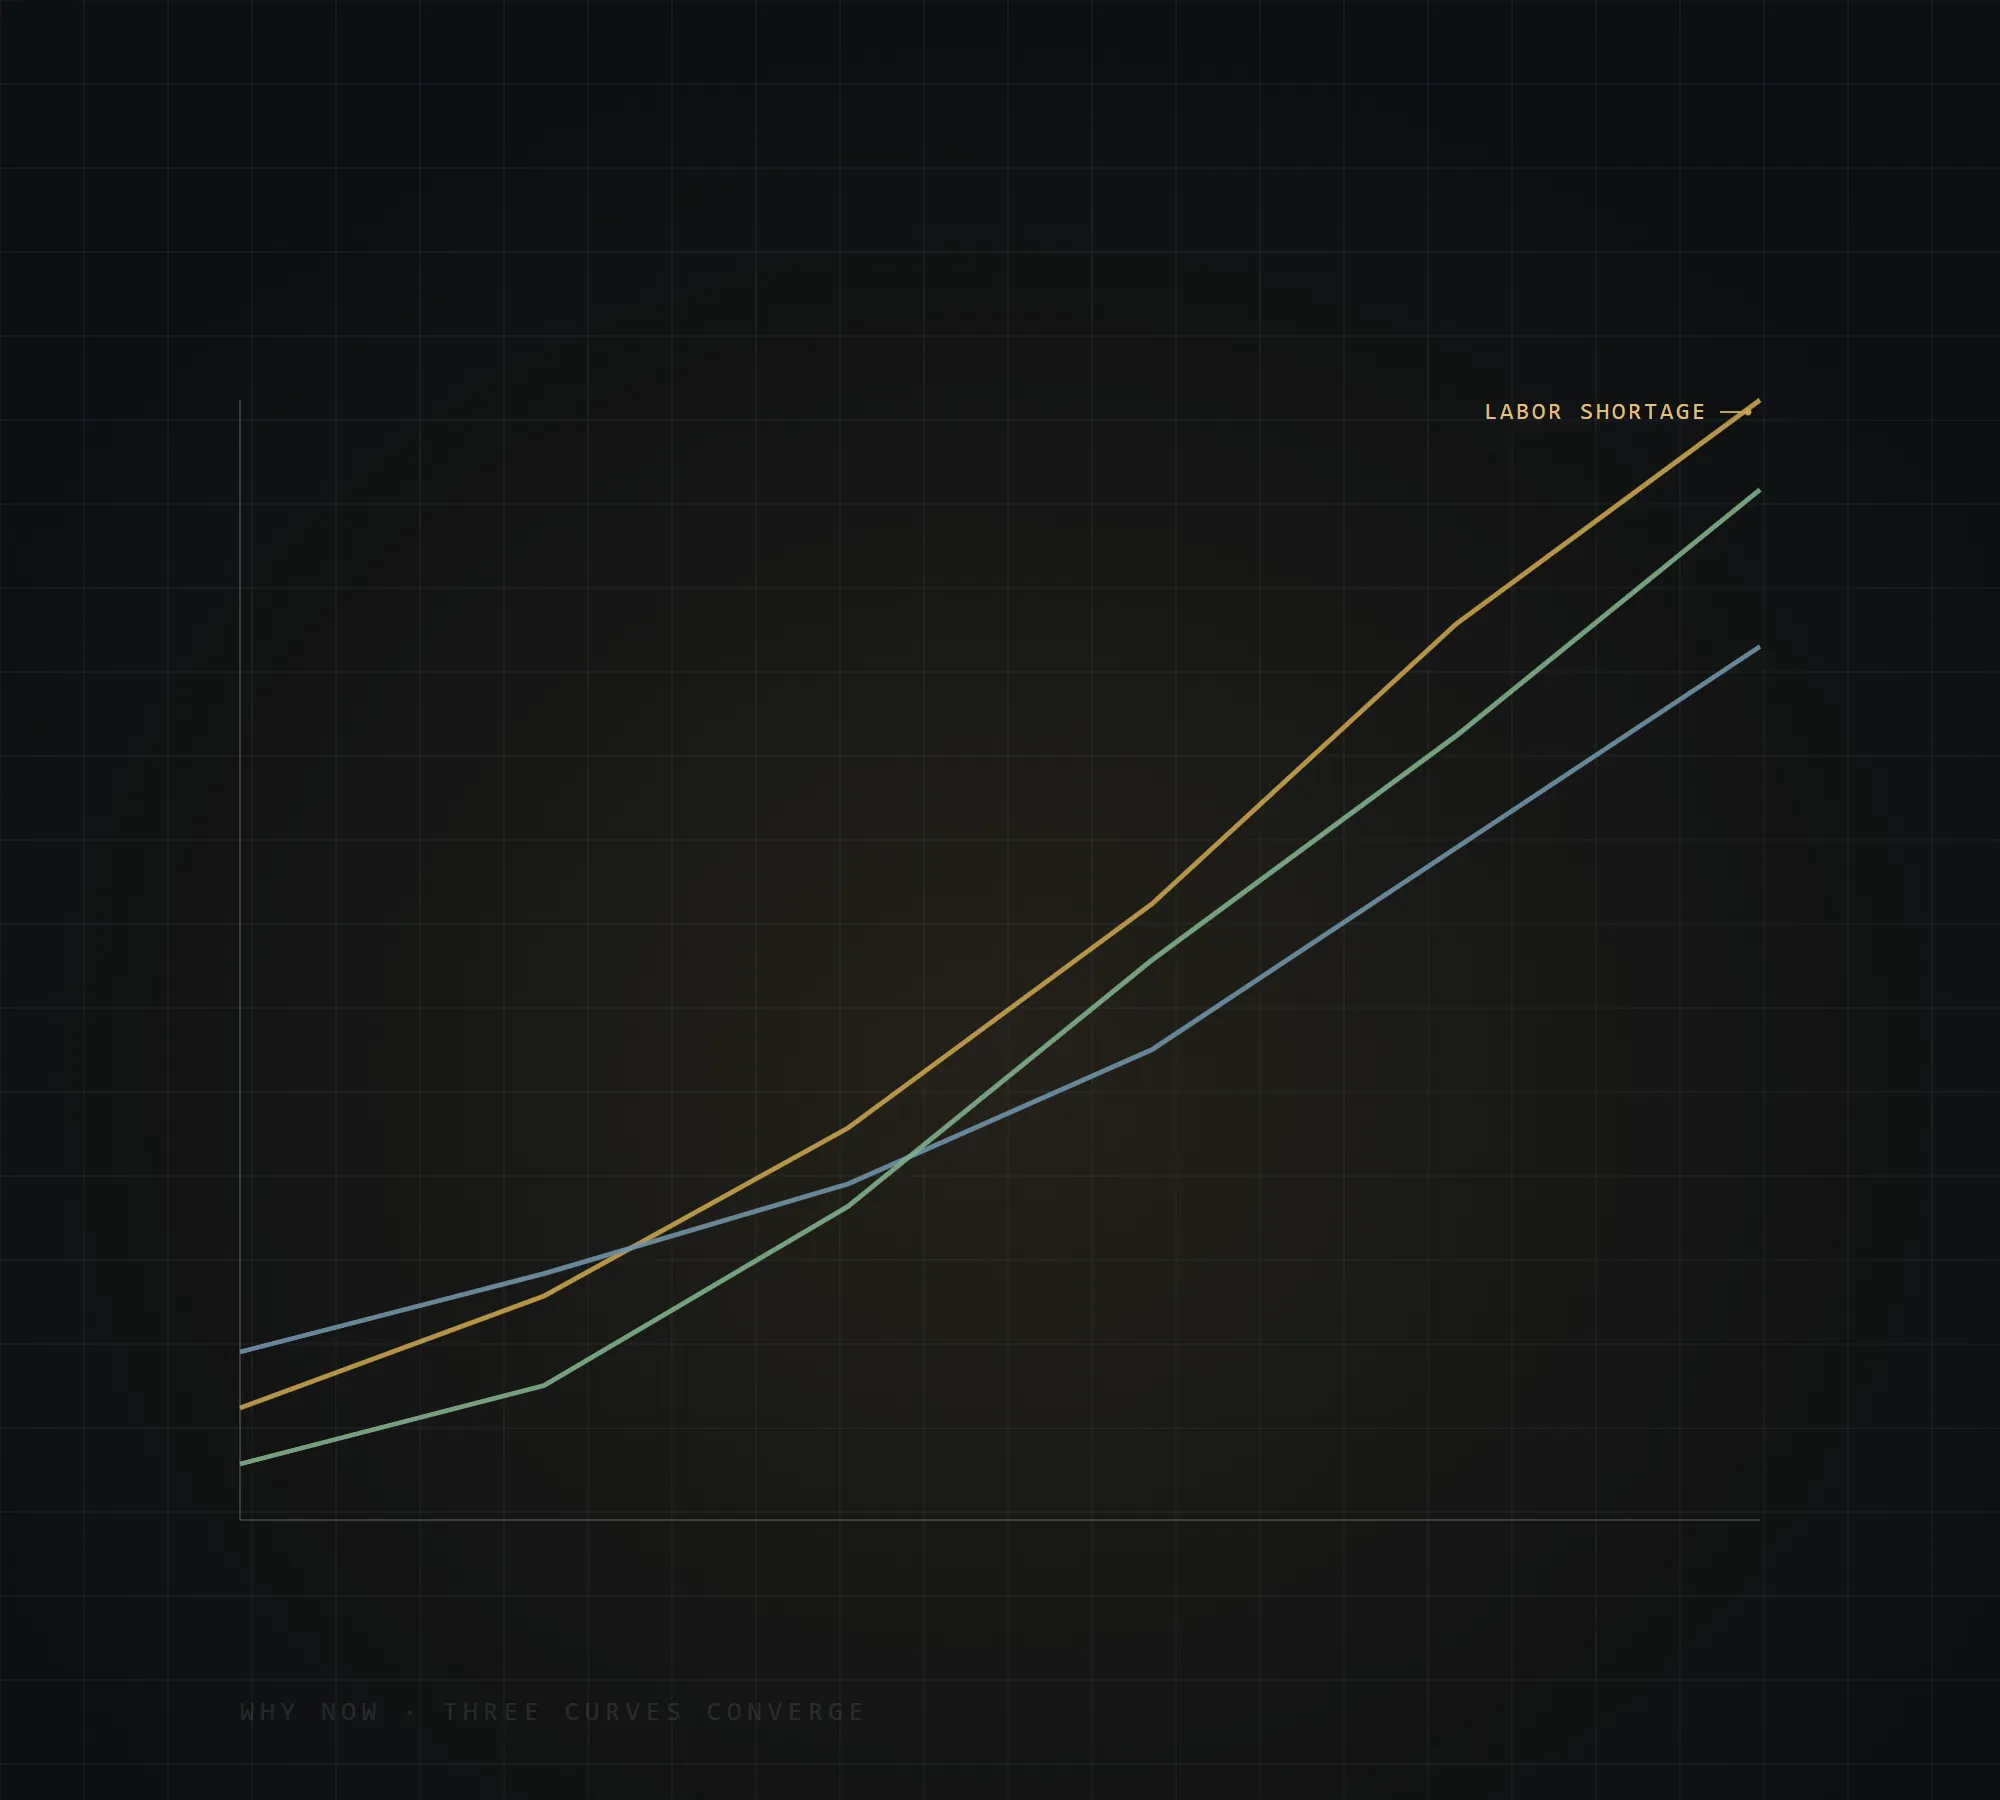
Three shifts put preconstruction in play at once.
01
The estimators are retiring
The labour shortage is deepest at the front of the project. Senior estimators are leaving faster than firms can train replacements, and the judgement leaves with them.
02
Capital is backing construction tech
Construction technology is drawing record investment. GCs now expect software to run preconstruction, not spreadsheets, and budgets have moved to match.
03
AI can finally read a drawing set
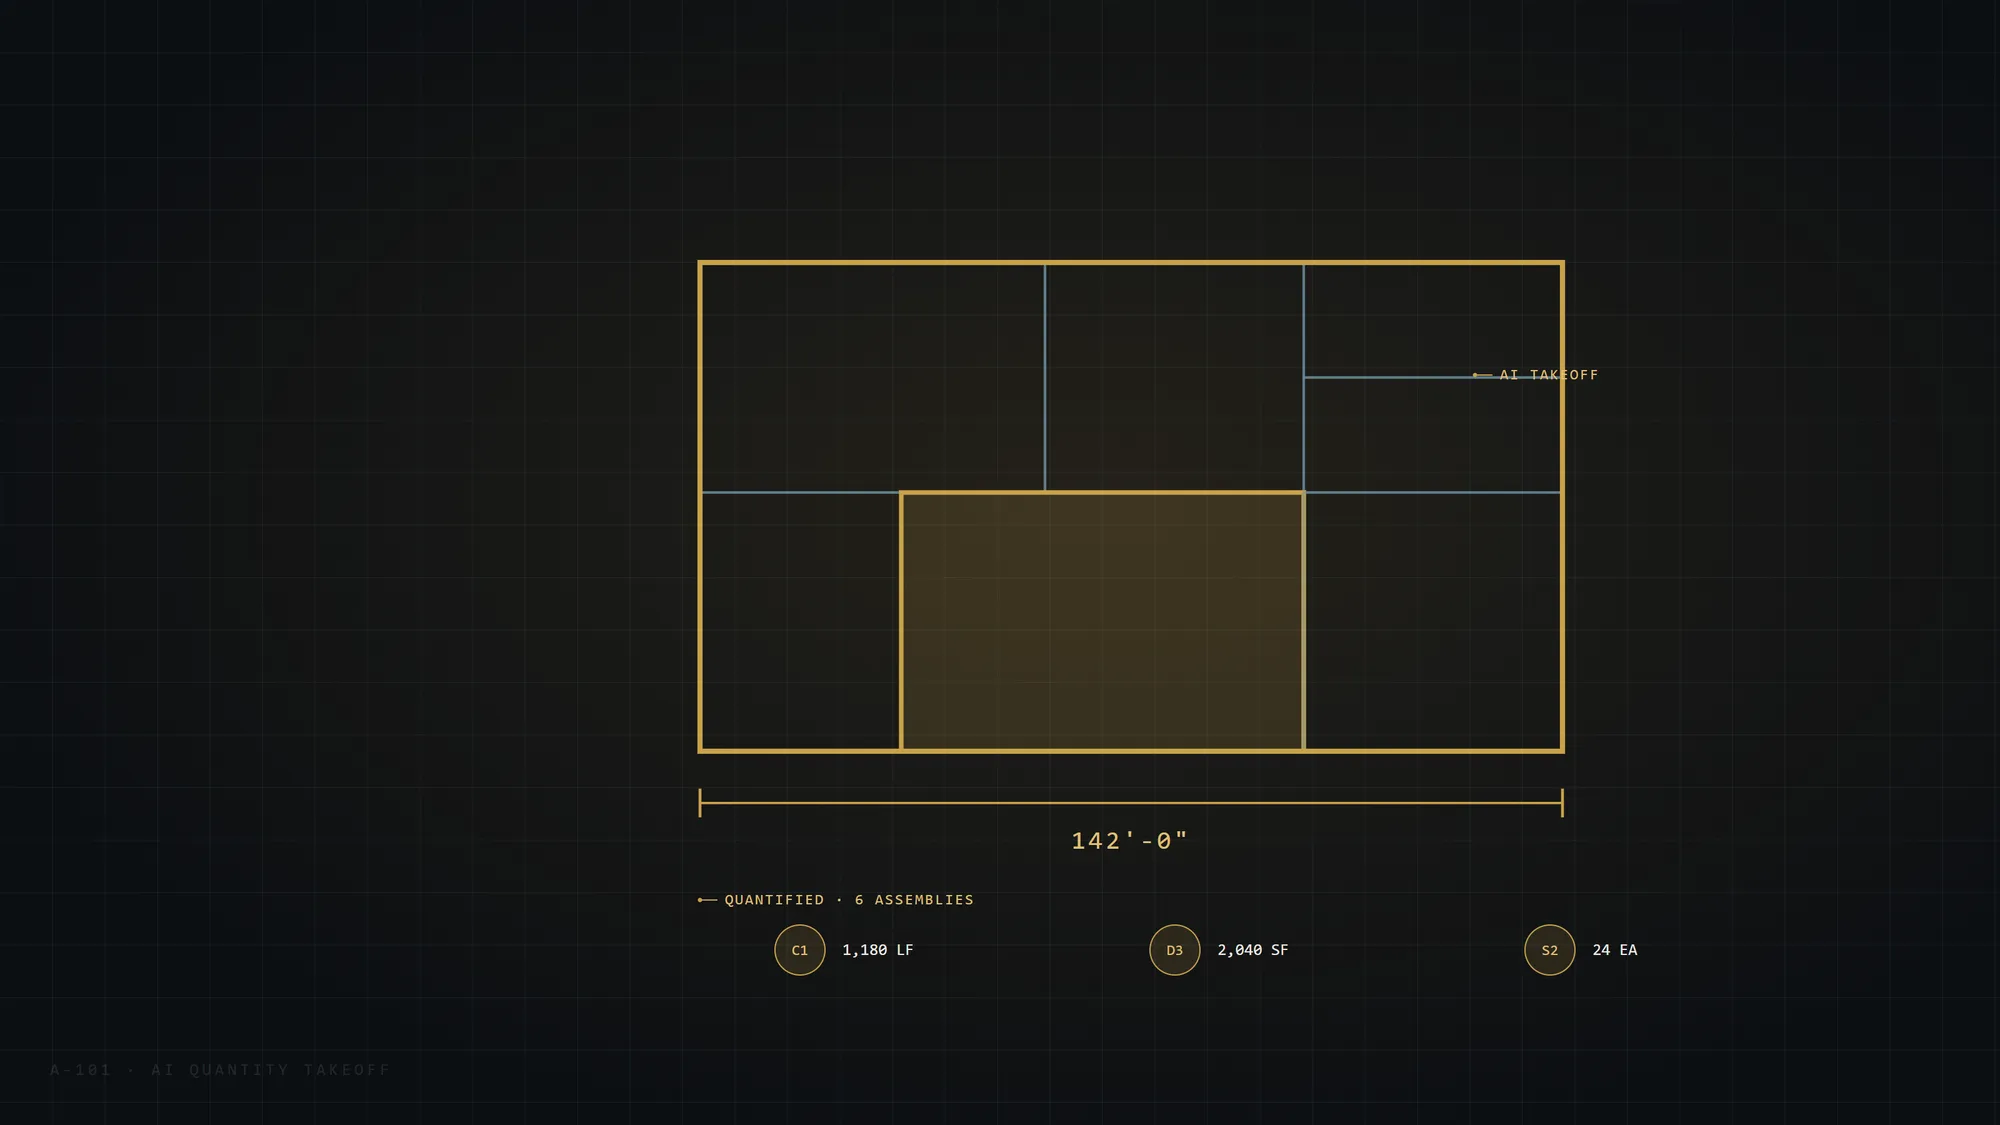
Models can now detect and reason over the geometry in a full set of construction drawings. A quantified takeoff in hours is a real capability, not a promise.
MK 03 / 10
BUSINESS MODEL
Priced by the seat, grown by the project.
Main income
$2,400 per seat, per year
Annual subscription for each estimator seat, plus usage priced per drawing set processed. Land one preconstruction team, then expand across the GC's project teams and offices.
Unit economics
Unit Economics
ARPA climbs from $70K to $141K as seats and projects grow. Net revenue retention runs 118% to 132%, so accounts expand faster than anything churns.
MK 04 / 10
Total Addressable Market
Segments weighted to a 27% blended growth rate through 2030.
Sources: FMI, ENR and Top Tier Advisory analysis, 2025.
Bottom-up build
Buyers in each segment times their annual spend.
Three segments of the construction estimating and preconstruction market.
Firms in scope, annual spend each, and segment growth rate.
$28B
Estimating and takeoff software
Firms
200,000
Spend / yr
$60K
Growth
26%
$12B
Preconstruction services
Firms
180,000
Spend / yr
$61K
Growth
22%
$11B
Bid and document management
Firms
250,000
Spend / yr
$20K
Growth
24%
$5B
MK 05 / 10
Serviceable Addressable Market
$6.5B
US commercial GC preconstruction software: a $6.5B serviceable market.
Filters applied to TAM:
United States only
The US construction market, where Plumbline sells and supports today.
Commercial general contractors
Firms that bid offices, schools, hospitals, mixed-use and industrial, not residential or heavy civil.
Software, not services
The software line of preconstruction spend, which is what Plumbline replaces.
Preconstruction workflow
Estimating, takeoff and bid assembly, not scheduling or field management.
MK 06 / 10
Serviceable Obtainable Market
Our target in 5 years
$48M
| Year | Paying GCs | ARPA | NRR | Total |
|---|---|---|---|---|
| Y1 | 40 | $70K | 118% | $2.8M |
| Y2 | 72 | $89K | 122% | $6.4M |
| Y3 | 135 | $100K | 126% | $13.5M |
| Y4 | 220 | $123K | 129% | $27.0M |
| Y5 | 340 | $141K | 132% | $48.0M |
Paying general contractors
MK 07 / 10
Industry Growth and CAGRPreconstruction software compounds at 27% a year through 2030.
FMI, ENR and Top Tier Advisory analysis, 2025.
27% CAGR in construction-tech software, 2025 to 2030.
40%+ of estimator hours still lost to manual takeoff.
3.3x market growth over the plan period.
Most GCs plan to raise preconstruction software spend.
MK 08 / 10
Market Challenges
The market is real, and so are the hurdles to winning it.
Changing an entrenched workflow
Estimators trust the manual process they have run for years.
We land on one live bid and prove the time saved.
Trust in the numbers
A wrong quantity can lose a job or a margin.
Every figure traces to a sheet, with the estimator in control.
Drawing and data quality
Drawing sets vary in quality and format across firms.
Models trained on real construction sets and tuned to each firm over time.
Enterprise sales cycles
ENR-400 GCs buy through long procurement and security review.
Product-led pilots pay back inside one bid cycle.
MK 09 / 10
Key Takeaway
A large market, opening now, ours to take.

Total Addressable Market
$28B
Serviceable Addressable Market
$6.5B
Serviceable Obtainable Market
$48M
Compound Annual Growth Rate
27%

MK 10 / 10