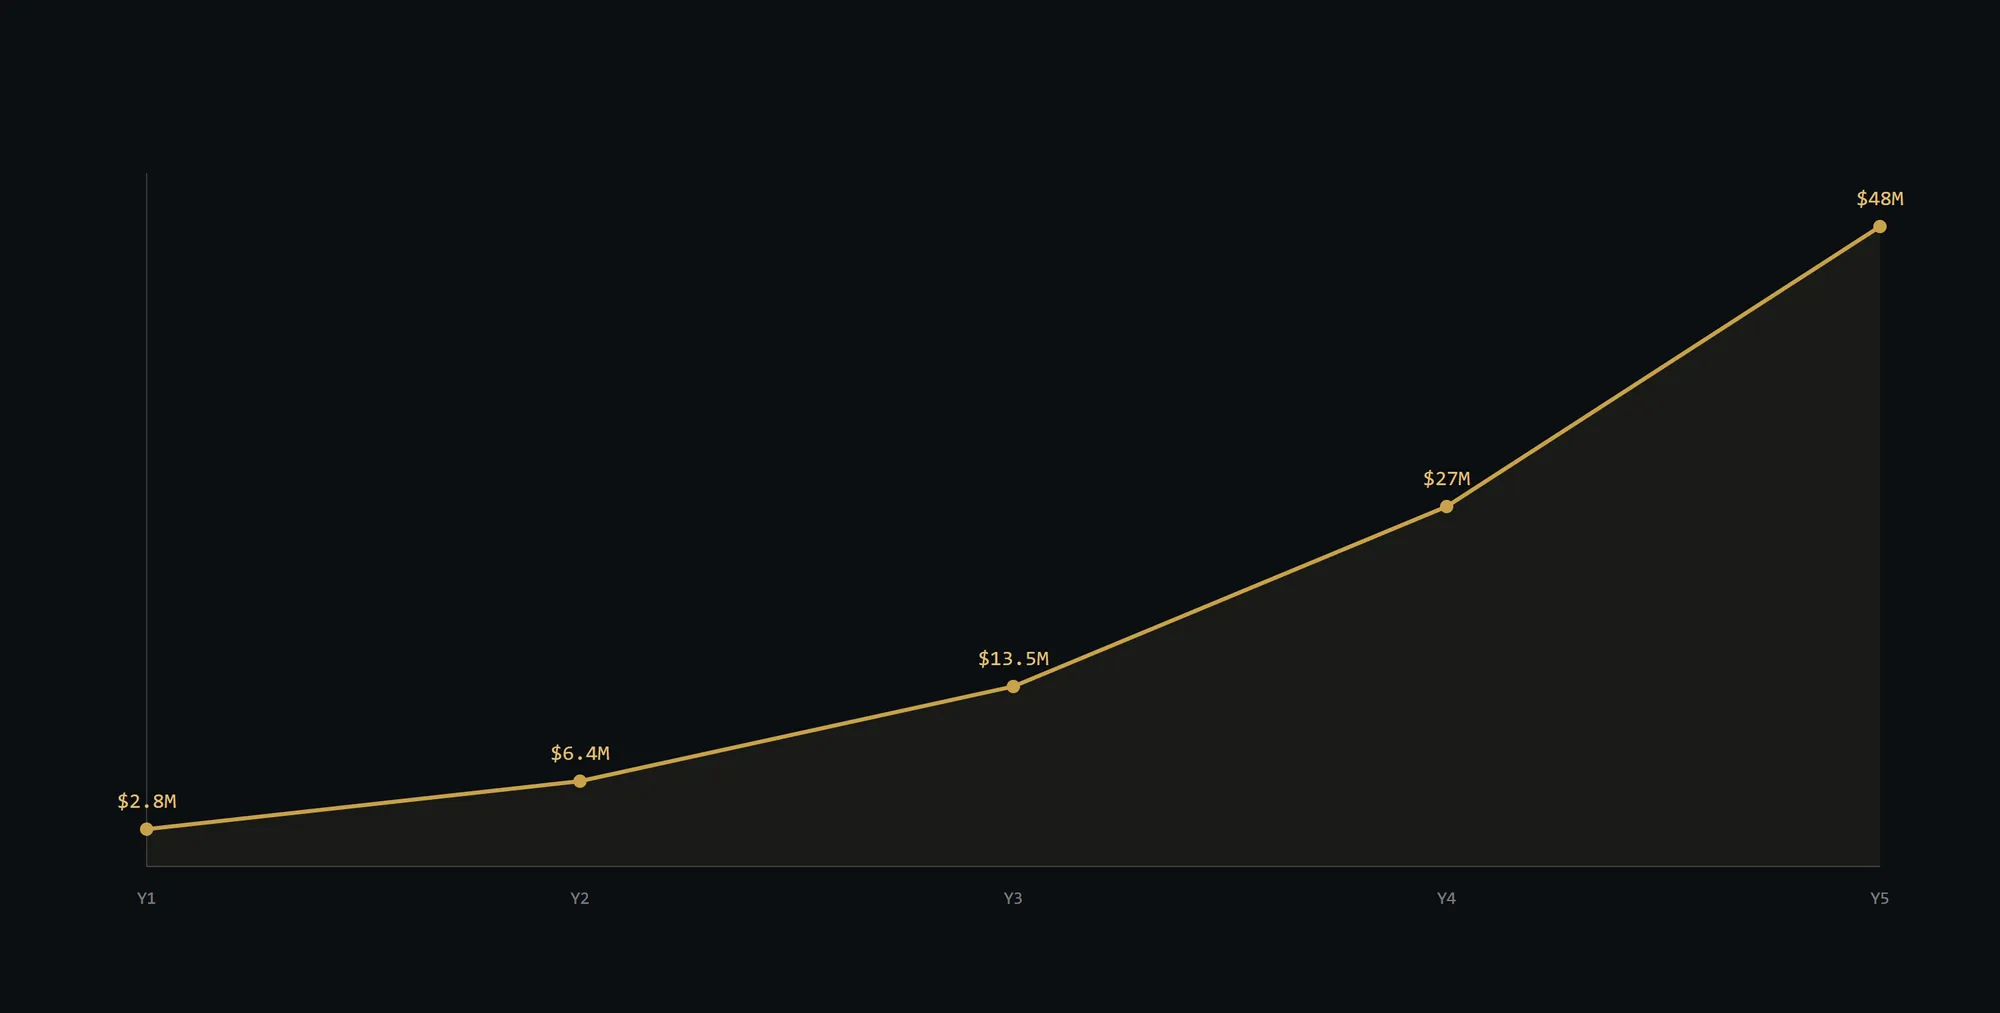
Revenue compounds roughly 17x over the plan while gross margin climbs from 68% to 78% and the business turns EBITDA-positive in Year 5.
Dashboard · 03
Use of the $15M raise
$15M
Series A raise
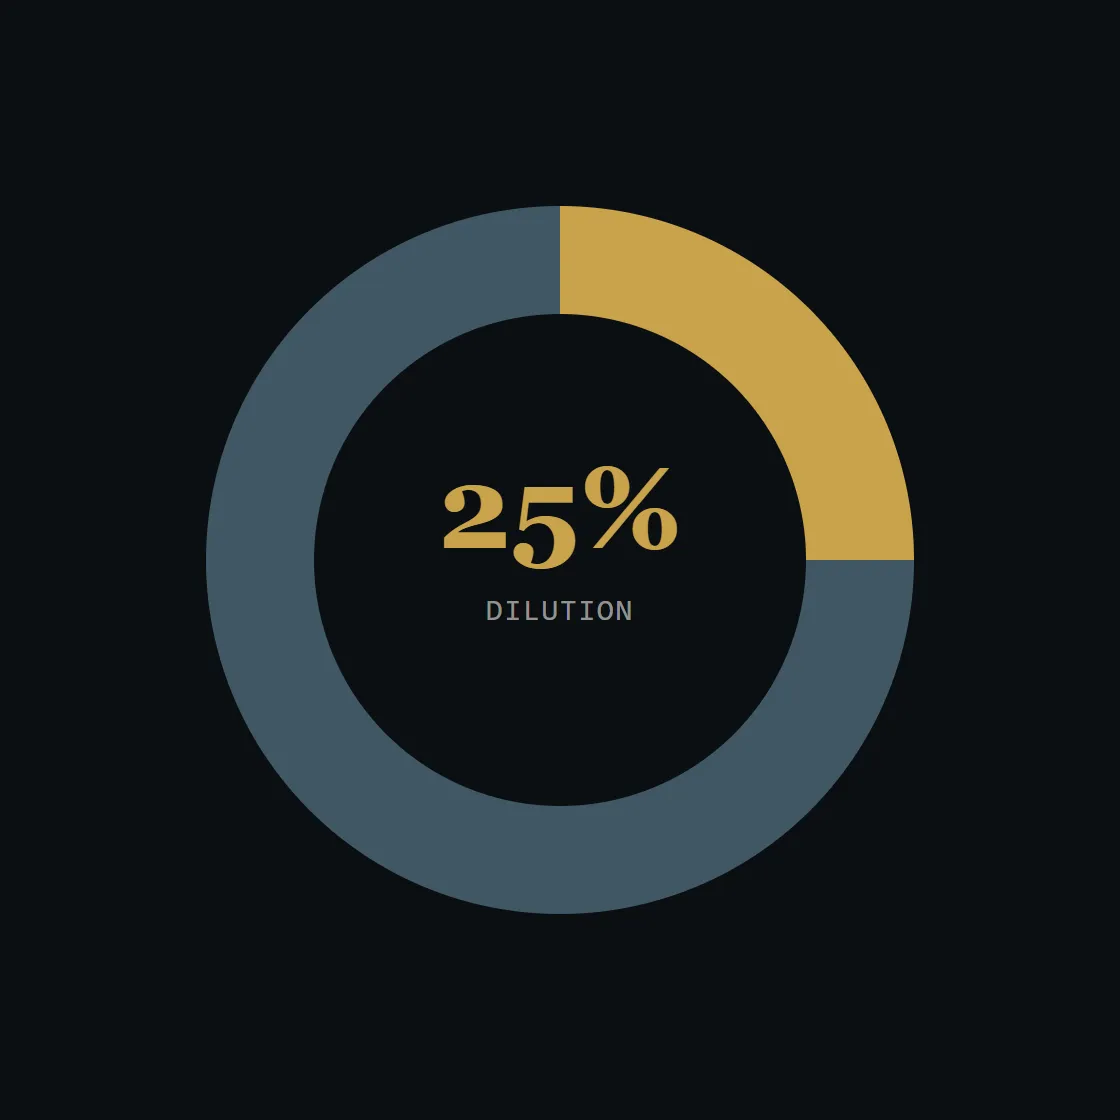
at $45M pre, $60M post
25.0%
Dilution
$60M post-money
$45M
Pre-money
weighted six-method engine
4
Use-of-funds areas
product, GTM, integrations, G&A
24-month use of funds — cash flow ($M)
Allocation of funds
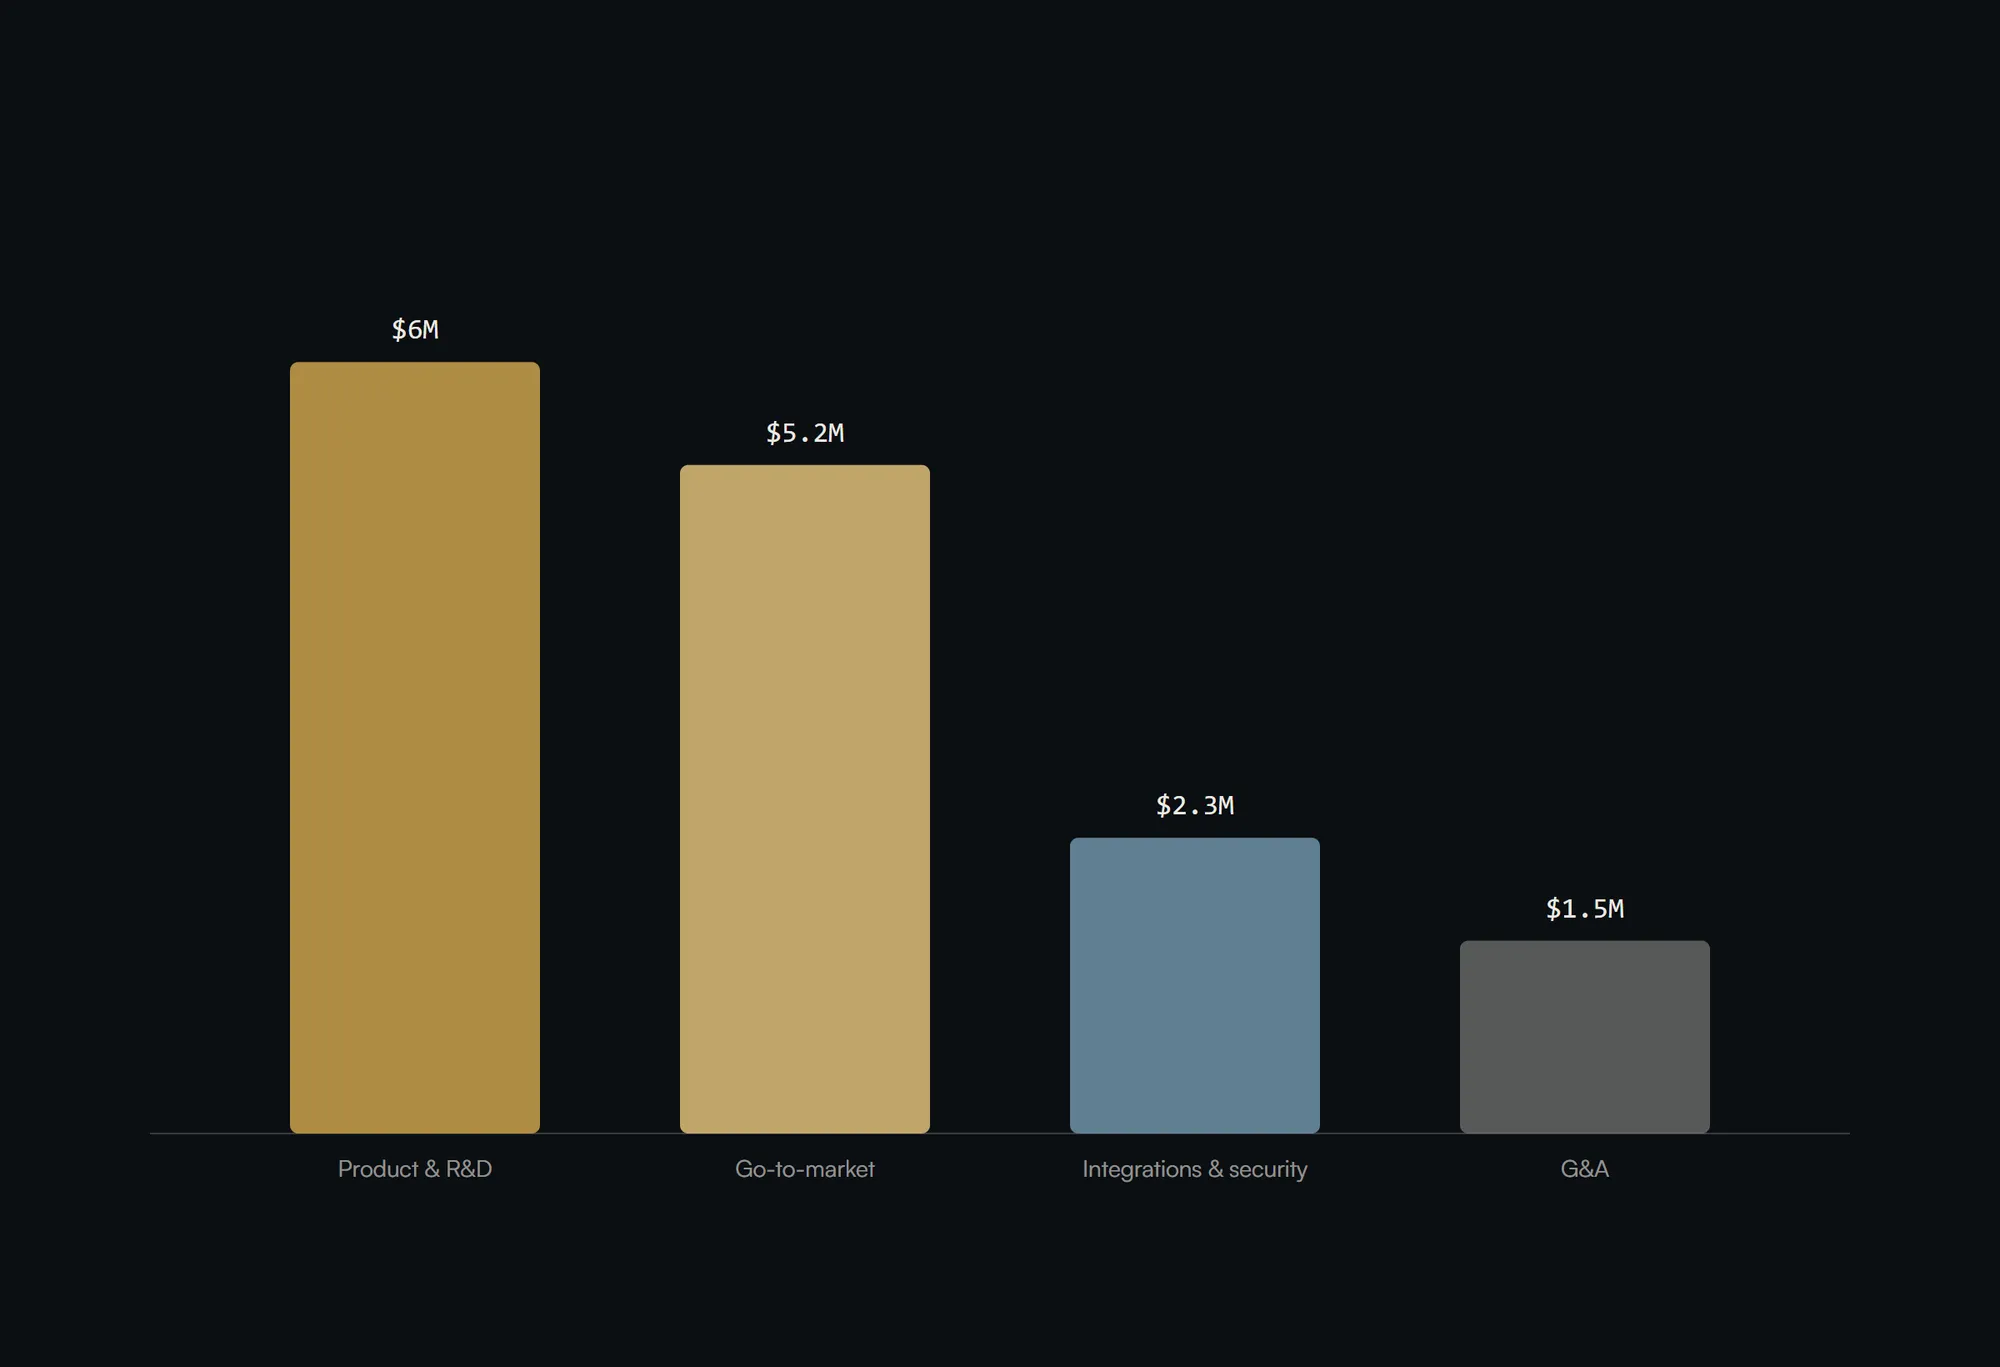
The $15M Series A funds four areas: product and R&D, go-to-market, integrations and security, and G&A. Priced at $45M pre-money, $60M post.
Dashboard · 04
Revenue and profitability
$2.8M
Year-1 revenue
starting ARR
$13.5M
Year-3 revenue
midpoint of the plan
$48.0M
Year-5 revenue
end of the plan
$5.8M
Year-5 EBITDA
swing from ($1.5M) in Year 1
5-year forecast — $M (annual)
Revenue steps from $2.8M to $6.4M, $13.5M, $27.0M and $48.0M. EBITDA swings from a ($1.5M) loss in Year 1 to $5.8M positive in Year 5.
Dashboard · 05
Customer growth
40
Paying GCs today
commercial general contractors
340
Paying GCs, Year 5
8.5x the base
3
ENR-400 logos
enterprise GCs already live
132%
Net revenue retention
118% today
Monthly clients — 24 months
Registered base — annual
Paying GCs grow from 40 to 340 across the plan. Three ENR-400 enterprise logos are already live, and net revenue retention reaches 132%.
Dashboard · 06
Revenue by source
$70K
ARPA today
per account, per year
$141K
ARPA, Year 5
about 2x expansion
$2,400
Per seat, per year
subscription base
132%
Net revenue retention
land and expand
Revenue by category — 24 months
Revenue by category — annual
Revenue is subscription at $2,400 per seat per year plus usage per drawing set. Average revenue per account doubles from $70K to $141K as teams and projects expand.
Dashboard · 07
Per-account economics
5.4x
LTV:CAC, Year 5
improves every year from 1.2x
14 mo
CAC payback
blended, inside one bid cycle
$141K
ARPA, Year 5
from $70K today
132%
Net revenue retention
expansion outpaces churn
Per-client economics — annual ($)
Unit economics compound. LTV:CAC improves every single year from 1.2x to 5.4x, CAC payback lands around 14 months, and net revenue retention climbs to 132%.
Dashboard · 08
Gross margin
68%
Gross margin today
Year 1
78%
Gross margin, Year 5
software-grade at scale
+10 pts
Margin expansion
across the plan
~$37M
Year-5 gross profit
at 78% of $48.0M
Cumulative gross profit — 24m
Gross profit & margin — annual
Gross margin expands from 68% to 78% as usage scales against fixed drawing-AI cost. Year-5 gross profit is roughly $37M on $48M of revenue.
Dashboard · 09
Cost of revenue
32%
Cost of revenue, Year 1
as a share of revenue
22%
Cost of revenue, Year 5
falls with scale
~$0.9M
Year-1 cost of revenue
at 32% of $2.8M
~$10.6M
Year-5 cost of revenue
at 22% of $48.0M
COGS components — 24 months
COGS components — annual
Cost of revenue falls from 32% to 22% of revenue over the plan as inference and hosting scale against a growing base.
Dashboard · 10
Go-to-market efficiency
18 mo
CAC payback, Year 1
early-stage motion
11 mo
CAC payback, Year 5
shortens every year
5.4x
LTV:CAC, Year 5
from 1.2x in Year 1
3
ENR-400 logos
enterprise motion working
Marketing spend — 24 months
Marketing spend — annual
Go-to-market efficiency improves across the plan. CAC payback shortens from 18 to 11 months and LTV:CAC reaches 5.4x. The land motion pays back inside one bid cycle.
Dashboard · 11
Sales and marketing mix
5
GTM motions
land, expand, enterprise, channel, marketplace
1
Team to land
a single precon team on a live bid
3
ENR-400 logos
enterprise motion live
132%
Expansion, NRR
seat and project growth
Spend split
Direct vs indirect — annual
The mix is a product-led land on a single precon team, expansion by project and office, an enterprise motion into ENR-400 GCs, plus channel and integration marketplaces.
Dashboard · 12
Path to profitability
($1.5M)
Year-1 EBITDA
investment year
($0.8M)
Year-4 EBITDA
approaching breakeven
$5.8M
Year-5 EBITDA
profitable
Year 5
EBITDA-positive
operating leverage kicks in
Overheads — 24 months
Overheads — annual
Operating expenses fund growth through Year 4, then leverage kicks in. EBITDA moves from ($1.5M) to $5.8M and turns positive in Year 5.
Dashboard · 13
Product and R&D
AI takeoff
Core engine
detect and quantify assemblies
Cost intel
The moat
the firm's own historical cost data
2
Major integrations next
Procore and Autodesk
Precon OS
The roadmap
takeoff to full preconstruction OS
Product dev — 24 months
Product dev — annual
R&D deepens the drawing-AI and cost intelligence, ships Procore and Autodesk integrations and enterprise security, and extends toward the full preconstruction OS.
Dashboard · 14
Team and efficiency
4
Founders
precon, CV, product, revenue
$2.8M
ARR today
run by a lean team
15 yrs
CEO estimating
ex top-25 ENR GC
3
ENR-400 logos
enterprise credibility
Revenue / employee — annual
Headcount — annual
Salary split — annual
A founding team from preconstruction, computer vision, product and vertical-SaaS revenue is running $2.8M ARR with three ENR-400 logos already live.